
The Power of Marketing Data Visualization in HVAC Manufacturer Sponsored Co-Op Marketing Programs
Chris Smith • December 13, 2025
The Power of Marketing Data Visualization in HVAC Manufacturer Sponsored Co-Op Marketing Programs
For decades, HVAC manufacturer-sponsored co-op marketing programs have represented one of the most powerful — and most wasted resource in the industry. Billions of dollars are invested annually across local markets to help dealers generate demand, drive leads, and sell equipment. Yet despite this massive investment, many manufacturers struggle to answer a few deceptively simple questions:
• Which co-op dollars are actually producing equipment sales?
• Where are leads leaking or being mishandled?
• Which dealers are excelling, and which are falling behind?
• Where should additional funding be allocated to take market share from competing brands?
The challenge isn’t a lack of marketing activity. It’s a lack of visibility.
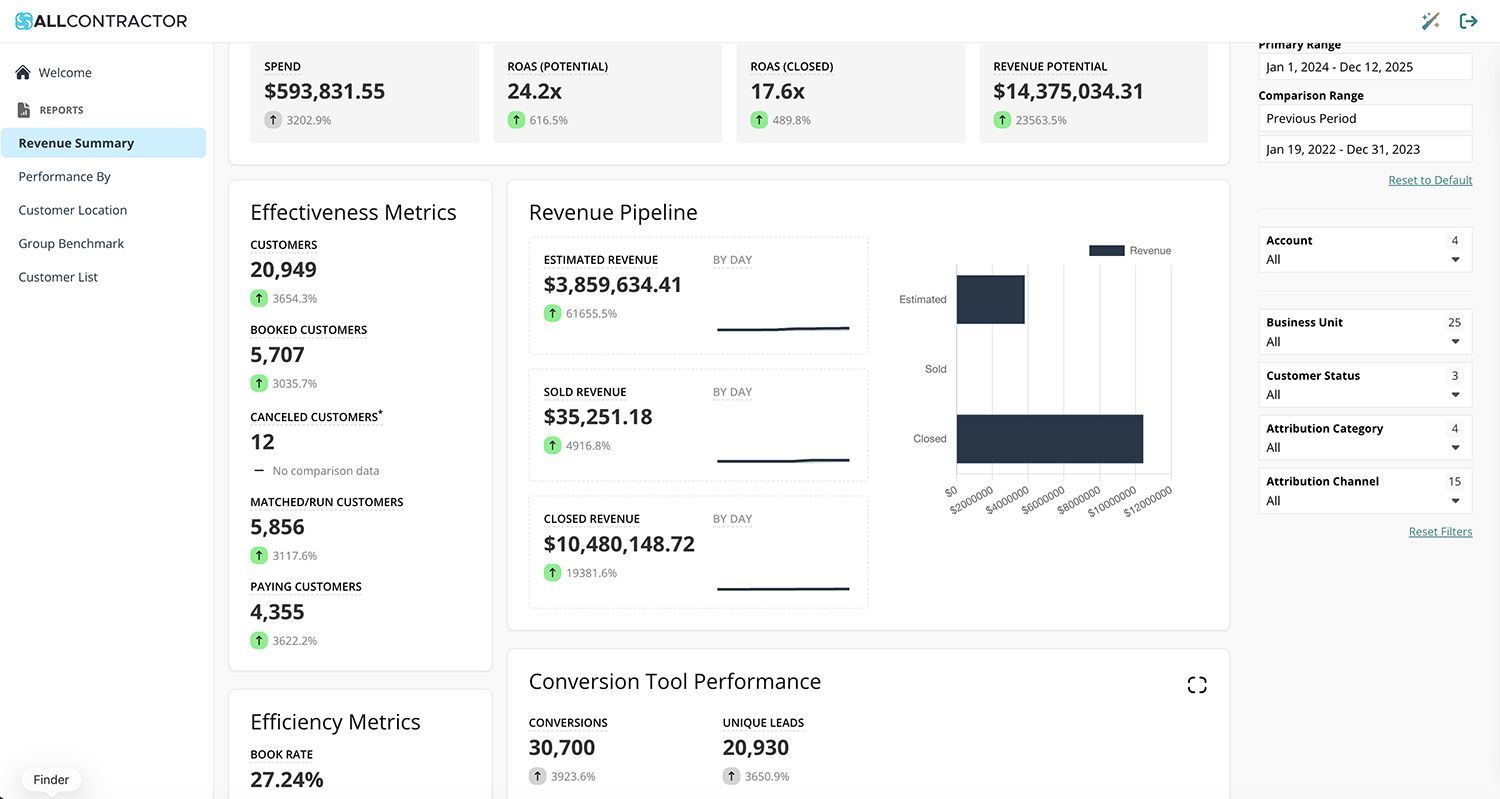
This is where marketing data visualization dashboards have moved from optional tools to absolute requirements for modern HVAC co-op marketing programs. When data is unified, visualized, and shared across manufacturers, distributors, territory managers, and dealers, co-op marketing transforms from a cost center into a performance engine.
What follows is a deep dive into why data visualization is so powerful — and why HVAC manufacturers that embrace it now will gain a decisive advantage in market share, dealer performance, and return on investment.
Data Visualization Dashboards Are Now a Requirement — Not a Luxury
Using data visualization dashboards in your co-op marketing programs is no longer optional if the goal is maximum effectiveness. In today’s competitive HVAC landscape, dashboards are a requirement to ensure marketing performance is optimized and co-op dollar waste is exposed.
One of the biggest hidden problems in co-op marketing is lead leakage.
Manufacturers invest heavily to generate demand, but once leads enter the dealer ecosystem, visibility often disappears. Leads go unanswered. Calls are missed. Follow-up is inconsistent. Sales opportunities quietly evaporate — and the co-op budget absorbs the loss.
Data visualization dashboards solve this by surfacing performance metrics that were previously buried in spreadsheets, CRMs, or disconnected platforms. When manufacturers can see how many leads are generated, how many are contacted, how many convert to appointments, and how many ultimately close, inefficiencies become impossible to ignore.
Waste thrives in darkness. Dashboards bring light.
Seeing Performance at Every Level: Dealer, Local, State, Regional, and National.
One of the most powerful aspects of marketing data visualization is its ability to display performance at multiple supply chain layers simultaneously.
With the right dashboard architecture, manufacturers can visualize:
• Individual dealer performance
• City and DMA-level trends
• Statewide marketing effectiveness
• Regional performance by distributor
• National brand performance across markets
This multi-layered visibility becomes exponentially more valuable when access is shared appropriately across stakeholders — dealers, territory managers (TMs), sales managers, distributors, and manufacturer leadership. Permission levels ensure the data in only accessible by the right individuals in the supply chain hierarchy.
Instead of siloed reports and fragmented conversations, everyone is looking at the same source of truth. Dealers understand how they compare locally with benchmarks. Distributors see regional strengths and weaknesses. Manufacturers gain national clarity without losing local nuance.
When data becomes visible and shared, alignment follows.
Every Dashboard Reveals the Truth — and Drives Improvement
Every time a new data visualization dashboard is launched, something remarkable happens: performance improves.
Why? Because dashboards reveal the truth.
Manufacturers and dealers suddenly gain insight into:
• How many leads are actually closing
• Individual salesperson close rates
• How many inbound calls are missed
• Speed-to-lead response times
• Conversion bottlenecks within the sales process
But the real value isn’t just awareness — it’s action.
Dashboards don’t just show what’s happening; they make it clear what needs to be fixed. A dealer with strong lead volume but low close rates knows sales training is needed. A dealer missing calls knows staffing or call-handling must improve. A distributor can identify which dealers need coaching versus which deserve increased funding.
Every instance of a data visualization dashboard results in improved dealer performance because problems become measurable — and measurable problems get solved.
Dashboards Tell the Geographic Story of Market Share
Marketing data visualization dashboards don’t just report performance — they tell a story across geography.
Manufacturers can quickly identify:
• Markets where brand penetration is strong
• Areas where competitors are winning share
• Regions where additional financial support could tip the scales
• Underserved DMAs with high growth potential
This geographic clarity allows manufacturers to strategically deploy co-op funds, not evenly distribute them. Markets that are ripe for conquest receive targeted support. Markets that are already saturated are optimized rather than overfunded.
Instead of guessing where dollars should go, dashboards make allocation decisions data-driven — enabling manufacturers to take market share with precision.
Unlocking Large-Scale Testing of AI and Emerging Marketing Technologies
Innovation in HVAC marketing is accelerating rapidly, especially with the rise of AI-powered tools. But innovation without measurement is risk.
Data visualization dashboards unlock the ability to test cutting-edge AI marketing tools across dozens or hundreds of dealers simultaneously — while clearly measuring impact.
Manufacturers can test:
• AI chat and lead qualification tools
• Automated follow-up systems
• Predictive lead scoring
• Call intelligence platforms
• Advanced attribution models
Because dashboards aggregate results across many dealers, patterns emerge quickly. Manufacturers can determine what works, what doesn’t, and what scales — without relying on anecdotes or isolated case studies.
This transforms co-op marketing programs into innovation laboratories, where new tools are validated with real-world data before being rolled out nationally.
Educating Dealers to Become Better Consumers of Marketing
One of the most overlooked benefits of data visualization dashboards is education.
Dealers often struggle to understand which marketing channels truly drive sales, not just leads. Without visibility, decisions are made based on instinct, vendor persuasion, or legacy habits.
Dashboards change that dynamic.
When dealers can clearly see which channels generate leads and close equipment sales, behavior changes naturally. Underperforming channels lose budget. High-performing channels receive more investment. Marketing maturity increases — without mandates or enforcement.
Educated dealers become better partners. They allocate co-op funds more intelligently, resulting in stronger ROI for themselves, distributors, and manufacturers alike.
Competitive Benchmarking Ignites Dealer Performance
HVAC dealers are, by nature, competitive. Data visualization dashboards harness that competitive spirit in a constructive way.
By defining maximum, mean, and minimum performance levels across demographics, dashboards allow dealers to see exactly where they stand relative to peers. A dealer who believes they are performing well may discover they are actually below average. That realization alone often triggers change.
This benchmarking doesn’t shame — it motivates.
Dealers who see higher-performing peers begin asking better questions, adopting best practices, and seeking guidance. Performance rises organically because expectations are now visible and achievable.
Competition, when fueled by data, becomes a growth accelerator.
Solving Co-Op Waste and Lead Leakage at Scale
Lead leakage and co-op waste don’t occur in isolation — they compound exponentially across dealer networks.
Data visualization dashboards attack these problems systematically. Missed calls, poor follow-up, underperforming campaigns, and inefficient allocations are identified and corrected across hundreds of dealers simultaneously.
The result is a synergistic lift in co-op marketing performance. Small improvements at the dealer level aggregate into massive gains at the manufacturer level.
This isn’t about spending more. It’s about stopping the bleeding and reinvesting saved dollars into what works.
Alignment Through a Single Source HVAC Marketing & Dealer Consultant Partner
Incorporating data visualization dashboards with an experienced single-source HVAC marketing firm — such as All Contractor Marketing — creates alignment that is nearly impossible to achieve otherwise.
Manufacturers, distributors, and dealers work from shared data. Messaging aligns across the DMA. Campaigns reinforce each other instead of competing. Dealers receive guidance backed by over 30 years of HVAC growth experience, not just funding.
Growth consulting replaces guesswork. Dashboards empower smarter decisions while experienced strategists help dealers act on the insights.
When technology and expertise converge, co-op marketing becomes collaborative instead of fragmented.
Increasing ROI and Market Share Without Increasing Budget
Perhaps the most compelling argument for data visualization dashboards is this: they dramatically increase co-op marketing effectiveness without increasing budget.
By reallocating existing funds toward proven channels, fixing operational leaks, and scaling best practices, manufacturers achieve higher ROI, stronger dealer performance, and increased brand market share — simply by shifting tactics.
This is leverage to unlock aggressive market share growth.
Manufacturers that embrace data visualization aren’t spending more. They’re spending smarter.
The Future of HVAC Co-Op Marketing Is Visible
The HVAC manufacturers that will dominate the next decade are not the ones spending the most — they are the ones seeing the most.
Marketing data visualization dashboards turn co-op programs into transparent, measurable, and continuously improving systems. They expose waste, unlock innovation, align stakeholders, and elevate dealer performance nationwide.
In a world where data exists everywhere, the advantage belongs to those who can visualize it — and act on it.
The future of HVAC co-op marketing isn’t louder.
It’s clearer.
Let All Contractor Marketing show you how you can clear up your HVAC co-op marketing program to move into the future of marketing while eliminating waste, improving performance, and gaining market share.
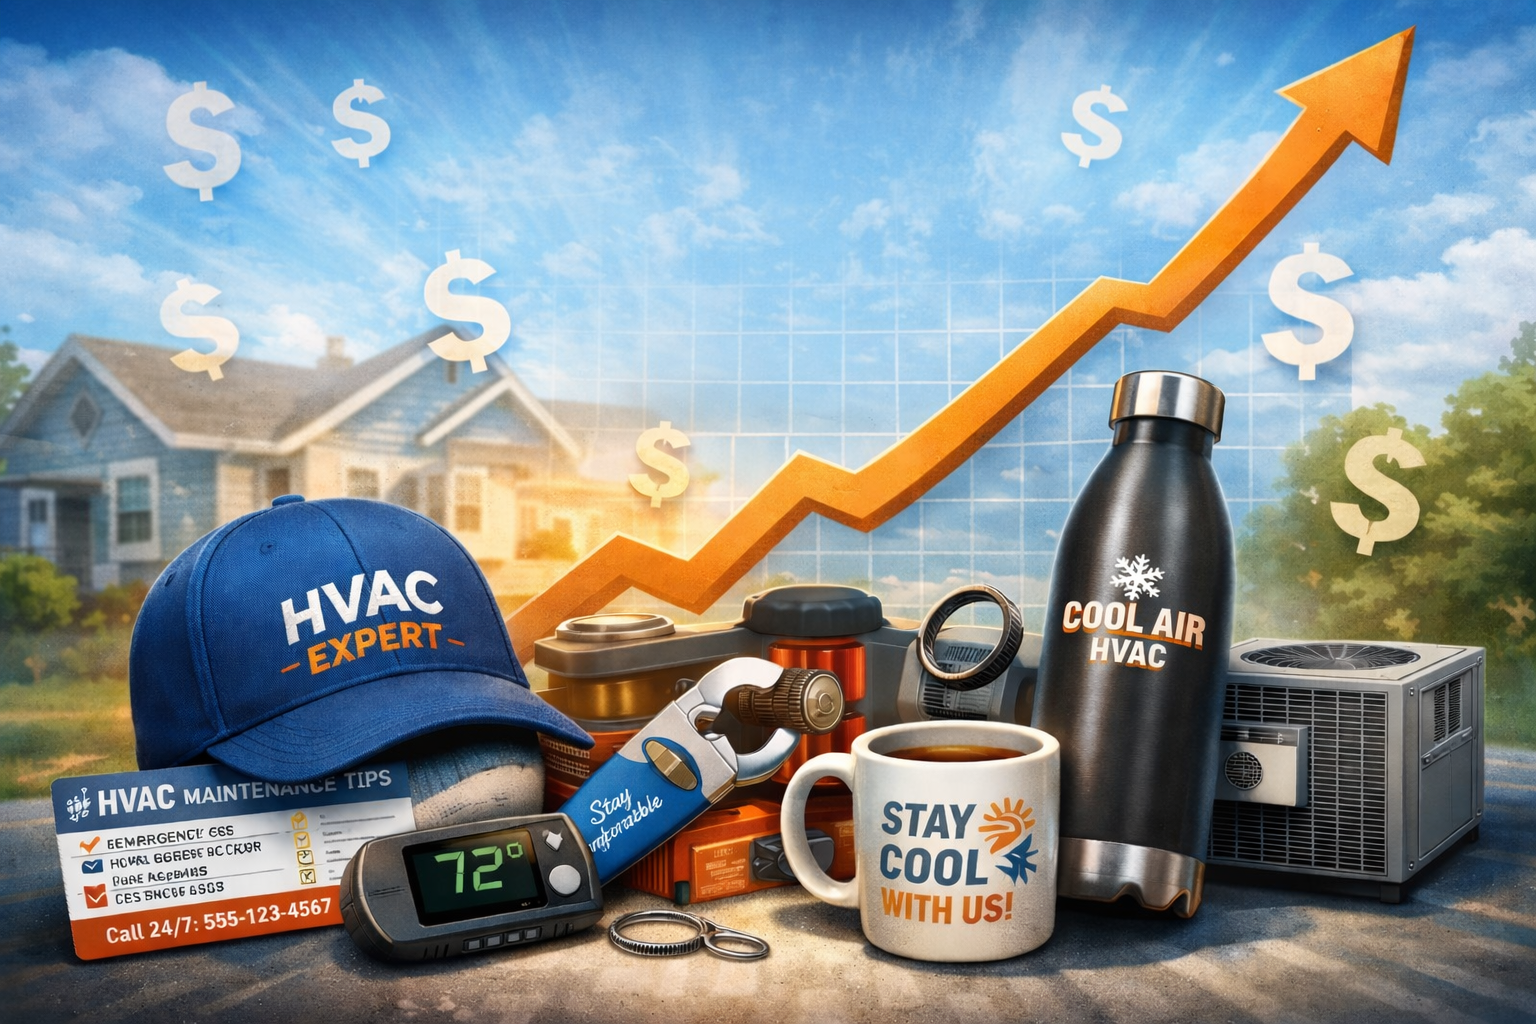
How HVAC Companies Can Use Promotional Products to Grow During a Slow Economy In times when budgets tighten and new leads are harder to come by, HVAC businesses need creative ways to stay top of mind with current and potential customers. Promotional products — when used strategically — can be a cost-effective marketing tool that strengthens brand awareness, boosts customer loyalty, and drives repeat business without draining your marketing budget. Here’s how HVAC contractors can get the most value from promotional products in a softer economy. 1. Take Stock of What You Already Have Before ordering new branded items, check your inventory. If you have leftover promotional gear from previous campaigns — things like branded pens, magnets, or reusable bags — consider repurposing them in upcoming promotions or customer appreciation efforts. Reusing existing stock helps stretch your budget further. 2. Choose Products That Reflect Your Brand and Audience Not all swag delivers equal value. For HVAC services target homeowners and property managers who value reliability and comfort. Useful items like branded thermometers, magnetic HVAC maintenance checklists, or quality reusable water bottles keep your logo visible and relevant all year long. Durable items increase daily use and repeated exposure, offering better long-term return on investment than throwaways. 3. Track Impact With Simple Metrics You can make promotional products measurable. Try adding QR codes that link to a special HVAC service offer or maintenance guide, or include promo codes redeemable for tune-up discounts. This lets you track how many leads and conversions came directly from your swag. 4. Prioritize Items With Practical Value In a competitive HVAC market, promotional products that get frequent use are especially powerful. Everyday tools like quality pens, calendars, or utility knives can keep your brand on a customer’s desk or keyring. Even branded magnets with your emergency contact number are practical and appreciated, especially during extreme weather months. 5. Buy Smart to Save Money Bulk ordering can significantly reduce per-item cost. If your business services multiple territories or branches, consider pooling orders with other teams or departments to benefit from economies of scale. Plan ahead to avoid rush fees and ensure timely delivery. 6. Design With Quality and Relevance in Mind Cheap giveaways may generate short-term attention but can diminish your brand’s professional image. Invest in quality items that people will want to keep and use. A well-designed HVAC branded item suggests reliability — just like your services. 7. Create Curated Brand Experiences Instead of handing out single items, assemble thoughtful care packages for specific audiences. For example: A winter readiness kit for homeowners that includes a door draft stopper, branded coffee mug, and maintenance coupon A property manager kit with office essentials and priority service contact details These curated bundles feel more valuable and strengthen emotional connection with your brand. 8. Partner for Co-Branded Opportunities Collaborate with complementary local businesses — like realty agencies or home improvement stores — to co-brand promotional products. Sharing costs and audiences can expand reach while keeping expenses down. 9. Use Promotional Products at Every Customer Touchpoint Give promotional products out at service calls, trade shows, community events, or when customers sign up for maintenance plans. These moments are opportunities to reinforce your brand and remind people that you’re the trusted HVAC partner they can count on. 10. Follow Up After Distribution Your job isn’t done when the item is handed out. Send a follow-up email or text message thanking customers for visiting your booth or for their business, and remind them how to redeem any special offers included with the promo item. This extra touch increases the likelihood of returning business. Final Thoughts Even in a slower economy, promotional products remain a powerful way to nurture customer relationships, build brand recognition, and generate measurable business results. With thoughtful planning, tracking, and customer focus, HVAC companies can turn simple branded items into tools that help grow their business and stay ahead of the competition.

How HVAC Businesses Can Streamline Social Media With Smart Publishing In today’s digital world, staying active on social media isn’t extra — it’s essential. For HVAC companies, regular social posts help you stay top-of-mind with local customers, share seasonal tips, promote service specials, and build trust in your community. But consistently creating and scheduling posts across Facebook, Instagram, LinkedIn, Google Business Profile, and more can quickly become overwhelming. That’s where automated social publishing tools come in. These systems take the guesswork and grunt work out of managing your HVAC social presence by planning, generating, and scheduling content for you — while keeping your brand voice consistent. Why HVAC Social Media Publishing Can Be Hard Most HVAC teams know the struggle: you start the week with good intentions, only to stare at a blank content calendar by Tuesday. Posting regularly across multiple platforms means: Creating new content ideas Customizing messages for each social platform Aligning posts with seasonal needs (think winter heating care or summer A/C checkups) Scheduling at times your audience will engage All of this is time-consuming — and that’s before you factor in approvals and edits. What Social Publishing Tools Do Modern social publishing systems automate the whole content cycle — from planning to posting. They: Generate ideas and posts AI and smart engines analyze industry trends, seasonal events, local needs, top-performing past posts, and competitors to suggest what you should post and when. Tailor content for HVAC audiences By learning your brand voice and service areas, these tools create posts that feel authentic — whether you’re promoting spring tune-ups, sharing energy-saving tips, or highlighting customer testimonials. Fill your calendar automatically Rather than starting from scratch each week, you get a filled content calendar with ready-to-publish posts that align with your goals and local HVAC needs. Handle multi-platform posting Good tools let you publish to Facebook, Instagram, LinkedIn, TikTok, and Google Business Profile all from one place. Support approvals and edits If you want oversight before anything goes live, built-in approval workflows make it easy for your marketing lead to review and adjust posts. Benefits for HVAC Companies Using a dedicated social publishing solution can transform how your HVAC business connects with customers: Save time Automated content generation and scheduling free your team to focus on service quality and customer communication rather than repetitive posting. Increase engagement Consistent posting paired with AI-recommended best posting times can help boost reach and interaction, bringing more eyes to promotions, maintenance tips, and seasonal reminders. Stay relevant locally Rather than generic national posts, these tools help craft messages that make sense for your specific service areas — a key advantage for local HVAC businesses trying to build regional authority. Grow your brand voice AI learns your style over time, producing content that sounds like you — not robotic or generic. Best Practices for HVAC Social Publishing Here are a few tips to get the most out of your social publishing system: Plan seasonal campaigns. Highlight preventative maintenance in spring and fall, energy-saving summer tips, emergency service readiness in winter, and any promotions you run. AI tools can help populate these into your calendar. Mix educational content with promotions. Balance service specials with helpful HVAC tips — like how to change filters or when to schedule a pre-winter check. AI tools often pull trend data to help you do this effectively. Review and customize. Automated uploads are great, but always glance at suggested posts to ensure they fit your brand and local audience. Track results. Use analytics to see which posts get the most engagement and let that guide future topics. Many social publishing tools include reporting dashboards. Conclusion For HVAC businesses aiming to grow their online presence without spending hours each week on content creation, automated social publishing tools are a game changer. By generating on-brand, locally tailored posts and scheduling them at optimal times, these systems make social media management efficient and effective — helping you attract new leads and deepen engagement with your community.
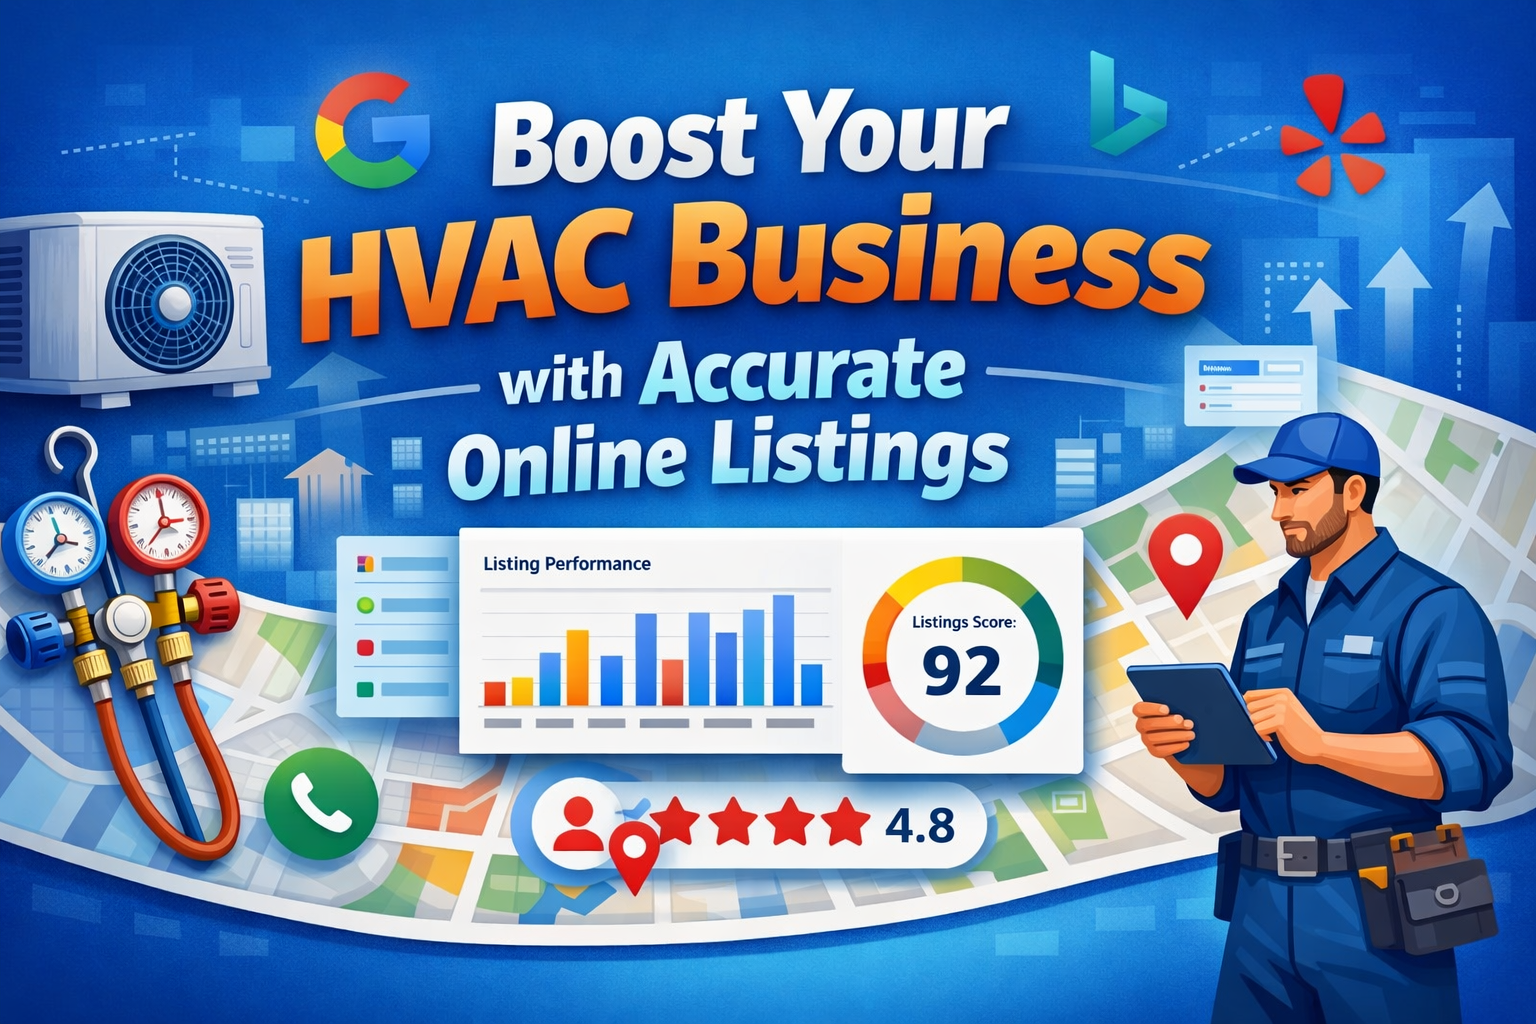
Why Accurate Online Listings Are a Game Changer for Your HVAC Business As an HVAC contractor, getting found online isn’t optional anymore — it’s essential. When homeowners search for “AC repair near me” or “furnace installation,” your business needs to show up with accurate, complete information across all the major directories to win that lead. One of the most impactful ways to improve your local visibility and attract more customers is through well-managed online listings and reporting. What Are Online Listings? Online listings are your business profiles across platforms like Google Business Profile, Apple Business Connect, Yelp, Bing Places and many industry-specific directories homeowners use to find HVAC services. These listings include your company name, address, phone number (NAP), hours, services offered and often customer reviews. Maintaining accurate listings helps you show up in local search results when potential clients are actively looking for HVAC help. Why HVAC Listings Matter More Than Ever Search engines use business listings to understand who you are and where you operate. Accurate, consistent listings across the web: Boost local SEO rankings because search engines trust consistent data. Connect customers quickly with up-to-date details like emergency service hours or new contact numbers. Increase credibility by showing reviews and complete business information. For HVAC contractors — where services are often urgent — listings can be the difference between a new job and a lost customer. The Power of Listings Reporting Simply having listings isn’t enough; you need to know how they perform. Listings reports help HVAC businesses analyze how customers find and interact with their profiles online. With reporting tools you can: Measure visibility and engagement like how many times your listings appeared and what actions users took (calls, clicks, directions). Check profile accuracy to ensure your hours, phone and services are correct everywhere. Track keyword rankings so you can optimize for HVAC-specific searches like “emergency AC repair” in your city. Compare performance over time to see what’s working and where to improve. This data allows you to make smarter decisions about where to invest your marketing efforts and how to optimize listings for more calls and bookings. Listings Score and Why It Matters Most reporting tools also give you a Listings Score, a snapshot of how strong your online presence is across platforms. A higher score means: More accurate information across directories Better local search rankings Higher trust from search engines and customers Improving your listings score over time should be part of your HVAC marketing strategy. Best Practices for HVAC Listings To get the most from your listings: Claim and verify your profiles on Google, Yelp, Apple and industry directories. Keep NAP consistent across all platforms — mismatches hurt your SEO. Use HVAC-specific keywords so your listings appear in relevant local searches. Encourage customer reviews and respond professionally. Monitor performance and update listings as your services or hours change. Conclusion For HVAC companies looking to grow online and convert more local searches into real service calls, accurate and well-managed online listings are foundational. Combine them with regular performance reporting to track progress and continuously improve your visibility. That’s how you stay ahead in a competitive local market and make sure customers find your HVAC business first when they need help the most.